How do we read a chart?
It’s essential to know how to read charts if we wish to have a concise and fair opinion over how the price of an asset is behaving. The period we’re interested in will be chosen from the top of the chart, where we have the periods written within frames: 1H, 1D, 1W, and 1M. We can customize these intervals according to what we need, specifically if we use a premium chart service provider. The time axis will be found in the lower part of the chart, along the borderline, and it’s meant to be read from left to right, in chronological order.
The price axis will be read from the bottom to the top, being the vertical border, whereas prices are visible on the right side of the chart. Also, the price can be observed by moving the mouse (or clicking) anywhere on the chart. This intersection will mention again the specific time when the price fluctuated. Depending on the platform we’re using to visualize graphs, these can be intuitive, customized, and easy to use.
What is the Moving Average indicator?
A Moving Average is one of the indicators we can use in Technical Analysis if we desire to know the price’s trend and how it is likely to fluctuate soon. This is because asset prices can make a lot of sudden moves in a short time, especially in the crypto sphere. But it is essential to ignore what is out of our area of interest, to observe the current trend better. Thus, we will watch two lines that are parallel while the trend is developing – and when it’s changing, these lines will intersect. When intersecting, a cross is formed – the indicator traders follow to receive a price-changing signal.
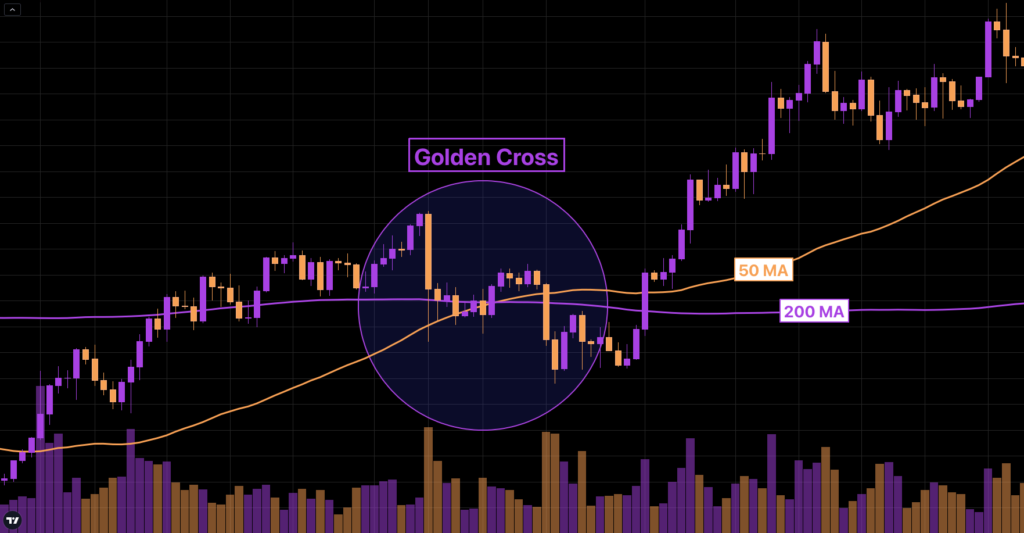
What are Golden Crosses?
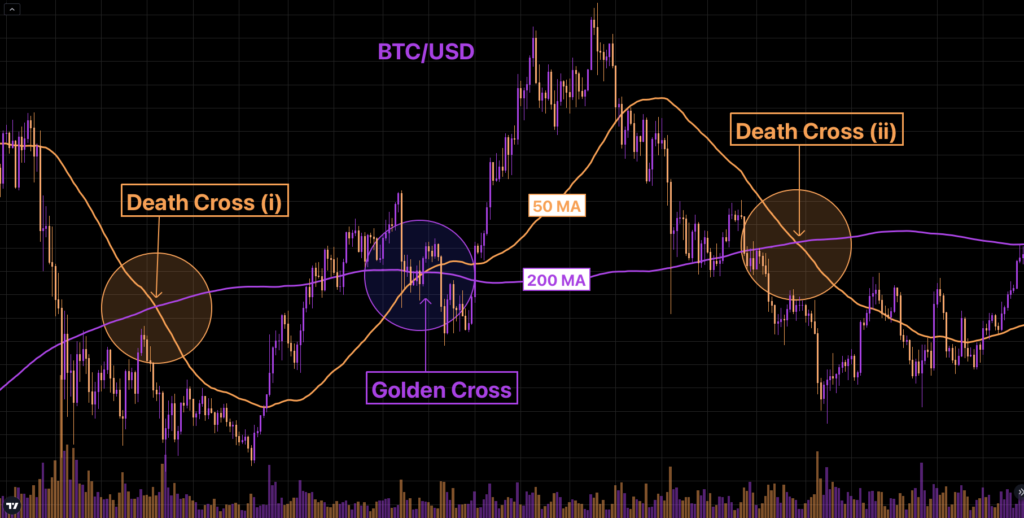
Golden Crosses represent the intersection of the 200 moving average with the 50 moving average, while the trend changes in the opposite direction, and the price starts growing over a specific period. The long period line of a 200 moving average meets a 50 moving average line and thus takes it upwards, at which point it forms a cross. When we want to see how far an asset can go, we say we are waiting for it to find its bottom or the limit. Such a cross intersection represents the return to normal, a reversal of the trend to the upside, or even a market turnover from Bearish to Bullish. Of course, this only happens after the trend has changed, and we can see the price rising, so it’s a confirmation, not a prediction.
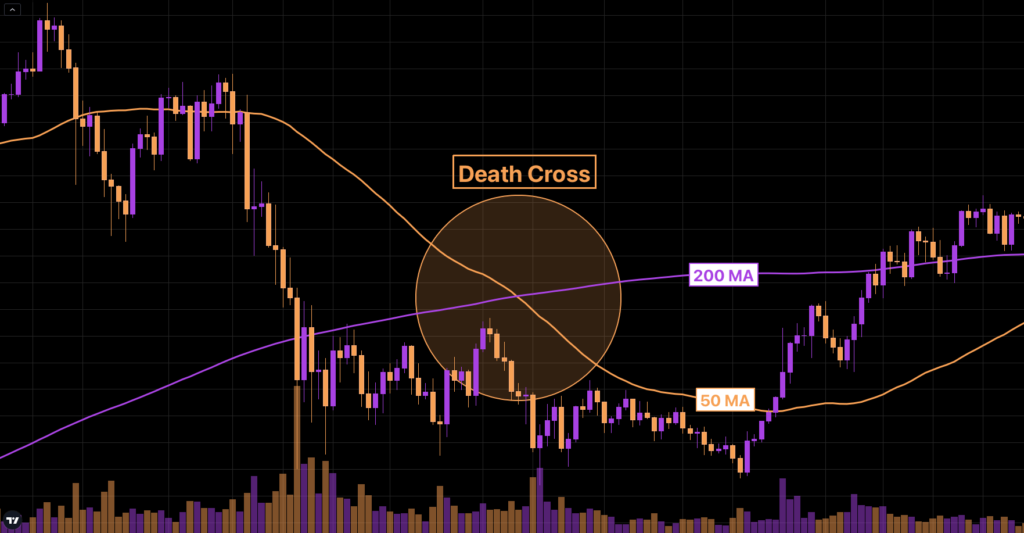
What is a Death Cross?
A Death Cross represents the opposite of a Golden Cross: a strong confirmation that the price trend is changing in sellers’ favor. The death cross indicates that the short-term moving average (50 days) has crossed below its long-term one, usually 200 days. This means there could be heavy selling in anticipation of this bad news. In the long run, buying cryptocurrencies is not a good idea when they form a death cross on the chart. The symbol for this indicator represents an accomplished price pattern that occurs in both up-and-down market trends alike, specifically during periods where investors expect more downside than upside potential because of negative economic news or other circumstances which might lead them to believe there will soon be another crash.
What are price charts?
Price charts are frames with sequences in the asset price, shown for periods we choose. Charts can show the evolution of an asset price over any period we’re interested in. Asset prices are drawn with lines on the axes. The vertical axis represents the price scale, and the horizontal axis represents the time scale. The indicators attached to a price chart show us the moves made by the price; with their guidance, we can guess where the price is heading. Price charts are helpful when analyzing both from a technical point of view and a fundamental one. For example, it’s essential to see how an asset has performed during a crisis, like the recession, the entrance and the exit from a legal process, etc.
The importance of Technical Analysis in Trading Activities
In the cryptocurrency market, the hype has an incredible report regarding the popularity and interest for a specific coin or project. However, no matter how often we’ve heard about a project or how good the presentation was, we always must research the internet for information about that asset. Like the equity market, where many traders rely on fundamental analysis, where a company’s income and business evaluation are verified – all these factors do not always reflect in the asset’s price. Therefore, even if a project doesn’t find itself in any legal process and has an excellent overall reputation, Technical Analysis is crucial when choosing an asset. By analyzing the price’s chart history, we can observe, with the help of indicators, the current trend and possible trajectories for its future valuation.
If you’re looking for a safe way to buy, trade and store over 450 cryptocurrencies, search no longer. Your Friendly Crypto Exchange is the platform that has all your needs covered. Register on IXFI to take your trading experience to the next level.
Disclaimer: The content of this article is not investment advice and does not constitute an offer or solicitation to offer or recommendation of any investment product. It is for general purposes only and does not take into account your individual needs, investment objectives and specific financial and fiscal circumstances.
Although the material contained in this article was prepared based on information from public and private sources that IXFI believes to be reliable, no representation, warranty or undertaking, stated or implied, is given as to the accuracy of the information contained herein, and IXFI expressly disclaims any liability for the accuracy and completeness of the information contained in this article.
Investment involves risk; any ideas or strategies discussed herein should therefore not be undertaken by any individual without prior consultation with a financial professional for the purpose of assessing whether the ideas or strategies that are discussed are suitable to you based on your own personal financial and fiscal objectives, needs and risk tolerance. IXFI expressly disclaims any liability or loss incurred by any person who acts on the information, ideas or strategies discussed herein.