The purpose of every trader over the short or medium-term is to realize the momentum direction of a particular asset and try to profit from it. Therefore, technical analysis is fundamental, and we will use various indicators when trading.
In addition, trading indicators are used to analyze the market and offer a perspective on the way cryptocurrencies will behave, especially Bitcoin. Because it’s the market’s leading cryptocurrency, Bitcoin sets the trend for Altcoins.
Finally, indicators are tools used in technical analysis to help traders better understand how assets of interest will move their prices. Indicators use charts and equations to see what buyers and sellers will continue to do and how traders will behave next. Indicated data is represented on a graph along with trading diagrams that offer clear visibility to traders.
Let’s explore some indicators that can help you understand the crypto market better.
The EMA Indicator
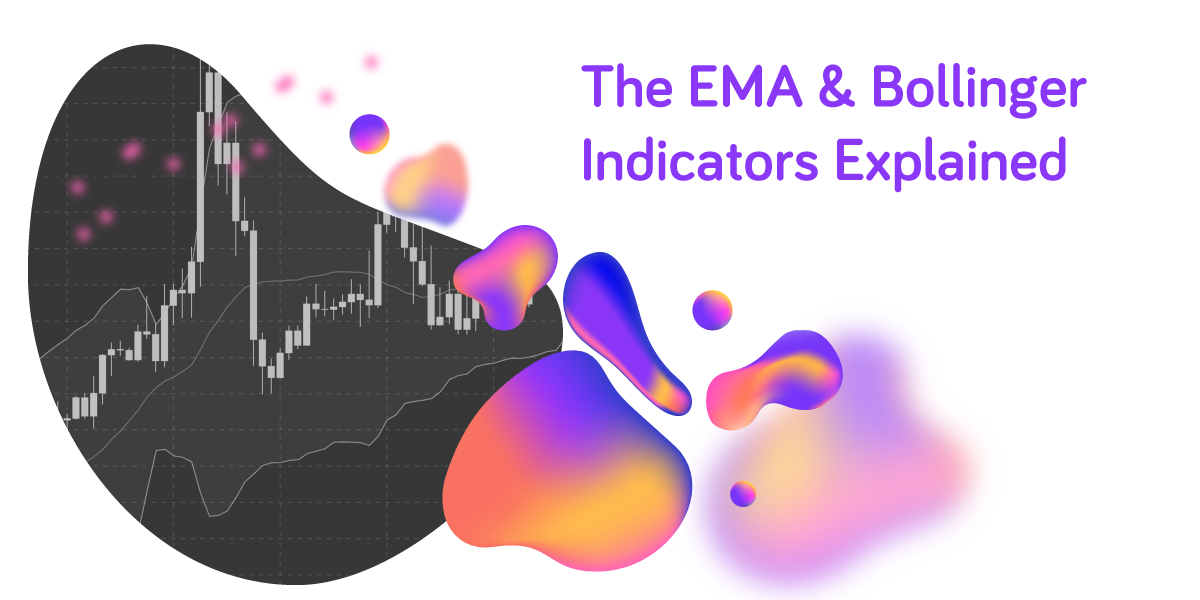
Exponential Moving Average is a technical indicator that tracks a transaction’s price over time. EMA is a type of Moving Average that pays more attention to recent price data. EMA was conceived to observe price trends over periods like the last 50 and 200 days. EMA’s calculation implies the application of a multiplier over the Simple Moving Average (or SMA). MA lines allow traders to see multiple EMAs on the chart simultaneously, depending on the chosen timeframe.
The MYC Indicator
The MYC trading indicator is a hidden indicator that incorporates the analysis of trends and velocity oscillators to decide wherever a cryptocurrency will join a Bull or a Bear trend. The trend line is a critical indicator element that shows if a long call will be created or not when the price grows and if a short-selling call will be initiated when the price goes down. Unlike other indicators, MYC offers a possible entry and exit point to the trader.
The Bollinger Bands Indicator
Bollinger Bands is an indicator used in technical analysis and works as an oscillator that measures the market’s volatility. The base reasoning for this indicator is to show the way prices are dispersed over a typical base value. A superior band, one in the middle, and an inferior band are designed to show the difference between extreme highs and extreme lows of a given market. The two outer bands reflect price fluctuations at their best. When the volatility is high, these bands extend (meaning that they’re getting further away from the middle band), and when the volatility is low, they get closer (to the middle band).
Price to Sale Ratio
The Price to Sale Ratio compares the market capitalization of a network, project, or company that issues a cryptocurrency with its income — very similar to how PSR works in the equity market. A low ratio may imply that the network is undervalued and versa — if the ratio is high, the project may be overvalued.
The Price to Sale Ratio is an ideal evaluation process, especially for early-stage projects with low or reduced net income. Therefore, this indicator can identify recovery situations or check if a company’s or cryptocurrency’s growth has not become overvalued. The indicator is useful when a company starts to suffer losses. As a result, the trader can use no income to better value the company’s cryptocurrency (or equity).
Stochastic Oscillator
The Stochastic Oscillator is an indicator that measures the current price of a cryptocurrency against the price range over multiple chosen periods. Because it can have a value between zero and 100, the idea is that the price should trade new highs when the trend is positive. On the other hand, when the trend is Bearish, the price may trade new lows. As a result, the Stochastic Oscillator is often used to see and predict overbought and oversold trends. Values over 80 are considered overbought, while levels under 20 are considered oversold, depending on the market’s sentiment.
The indicators presented above can be really valuable in your trading practices, so make sure to get acquainted with them and do more research. Your Friendly Crypto Exchange is the perfect place to test out your trading knowledge and skills because the risks of security breaches and hidden fees are not a problem to worry about. Join IXFI and follow us on our social media channels to take your trading to the next level.
Disclaimer: The content of this article is not investment advice and does not constitute an offer or solicitation to offer or recommendation of any investment product. It is for general purposes only and does not take into account your individual needs, investment objectives and specific financial and fiscal circumstances.
Although the material contained in this article was prepared based on information from public and private sources that IXFI believes to be reliable, no representation, warranty or undertaking, stated or implied, is given as to the accuracy of the information contained herein, and IXFI expressly disclaims any liability for the accuracy and completeness of the information contained in this article.
Investment involves risk; any ideas or strategies discussed herein should therefore not be undertaken by any individual without prior consultation with a financial professional for the purpose of assessing whether the ideas or strategies that are discussed are suitable to you based on your own personal financial and fiscal objectives, needs and risk tolerance. IXFI expressly disclaims any liability or loss incurred by any person who acts on the information, ideas or strategies discussed herein.


